dbt (data build tool) tutorial with a real world example

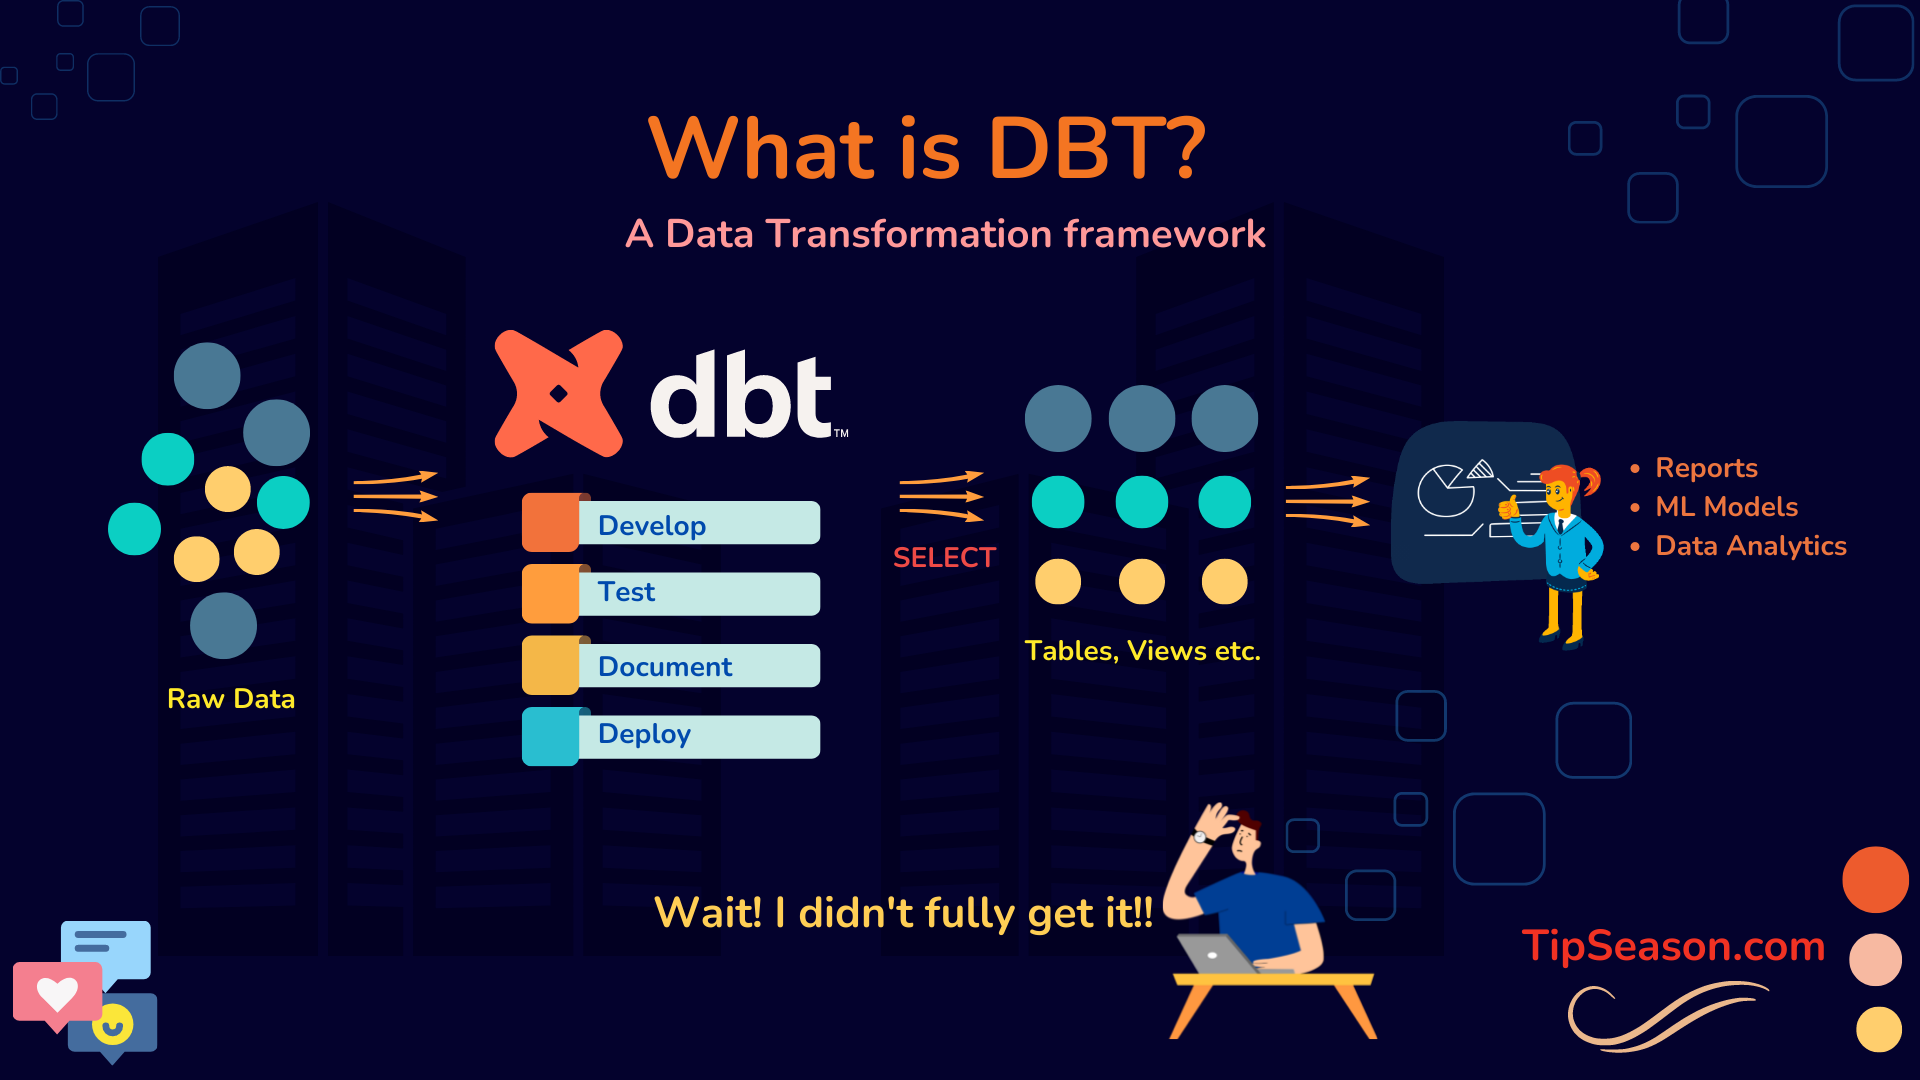
dbt is a developmental framework that helps doing data data tranformation with simple SELECT queris.
dbt (data build tool) has become one of the most used developmental frameworks for Data transformation. However most people don’t actually get What, Why and How part of dbt. In this guide we will go through basics of dbt focusing primarily on What is dbt! and where does it fit with a real world project example. We will slowly evolve from ETL to ELT process and finally understand the exact use case of dbt. Make sure you read through end of this article to learn a lot of Data Analytics and Data Analysis topics in real world.
What is dbt ?
Let’s say you have a huge amount of raw data. For beginners, raw data can be any kind of data collected from different sources and it can contain various information like urls, payment details, order information and so on. As you can imagine, this data can contain uncleaned rows such as null values, duplicates and what not right. Now, with this raw data, you want to do some data analysis for your reports or may be feed into some machine learning model and so on right!.
So dbt is a development framework that helps you transform this raw data into meaningful data objects such as database tables, views etc , using simple SELECT queries.
Now once you have these data objects ready, you can use those to create your own metrics, ML models or any other data analytics. To do that, with dbt you can develop, test, document and deploy the entire data transformation changes.
Maybe you still didn’t get it fully Right! Let’s take a real world example.
dbt Real world example
Imagine you are running an e-commerce website something like Amazon or Shopify or any other online store. Now, things were pretty good until, one day, you suddenly started receiving a lot of complaints from your customers saying, Hey! we are not getting orders delivered in time. Well, that’s a serious problem!! To understand what’s going on, you want to dig into the root cause of why these orders are not getting delivered in time. So you want to build a simple metric like
How many orders are not getting delivered within the estimated time and what is the reason for the delay?
So basically we are trying to build a report containing fields like order_id, tracking_id and reason_for_delay.
Well that seems to be pretty easy right! But let’s take a look at how this can get complicated.
ETL Data Pipeline
To solve this problem at scale, Let’s first try to understand what ETL is!
ETL Data Extraction
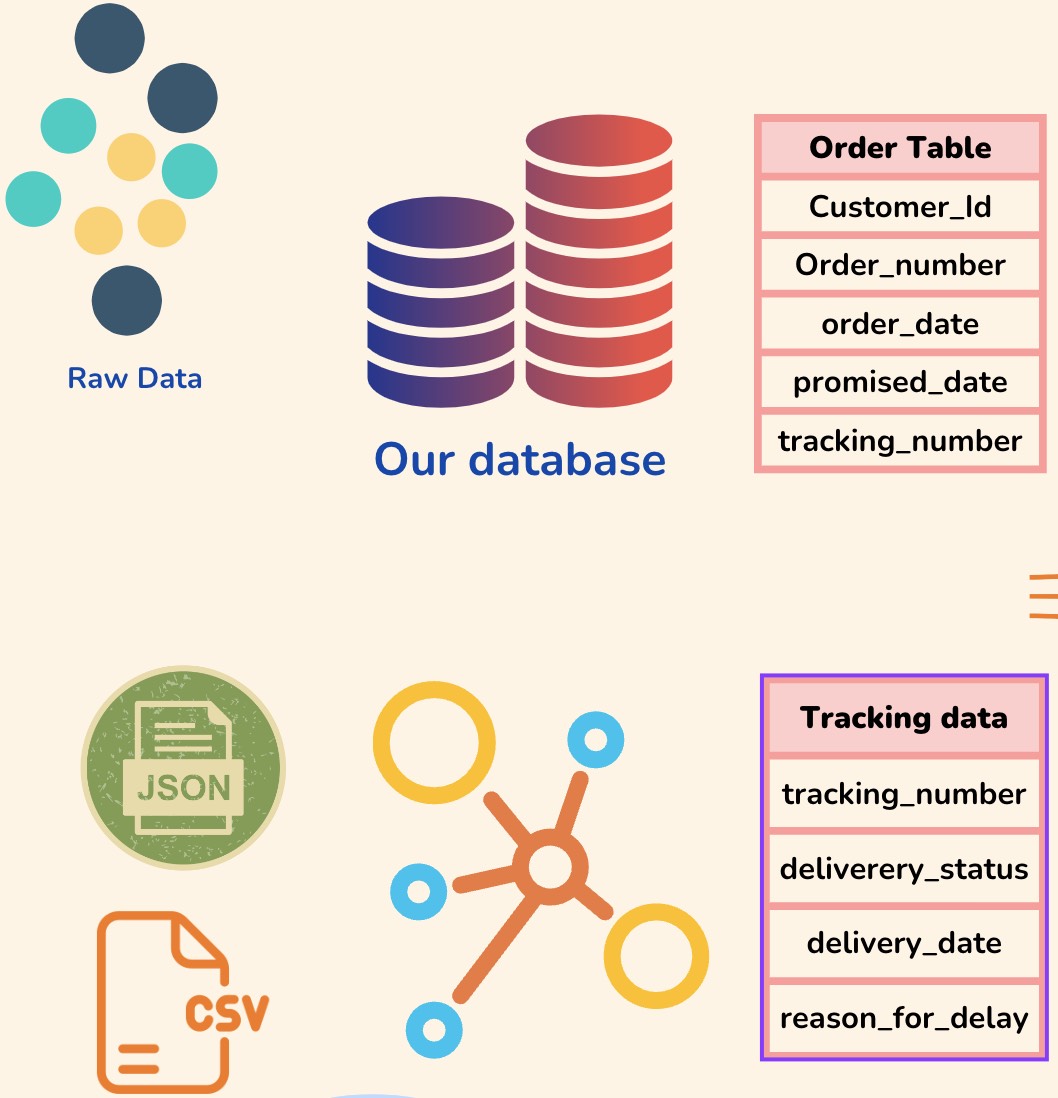
In our example, first thing you might be doing is to somehow extract this information into a common place. For simplicity, assume that you got that data into two tables i.e. order table (data source1) and tracking table.
Since customers can place orders on our website, we can have some of the information like order_number, order_date, tracking_number in our own database tables.
Now for the actual delivery of these orders, let’s say we are relying on a third party provider (like fedex or ups) to deliver orders to the customers, which is a very common use case in the real world right.
In this case, the order tracking information like delivery_status , delivery_time, reason_for_delay might be present in a different data source on the third party provider right! And one more complication could be that they can provide the data in different formats like JSON, CSV, Database, Queues and so on.
So as you can see that data can be scattered in multiple places and if we have to build our metric, we need to join this data from various sources and build our data models. In this case we have tracking_id as a common field across the sources.
So the first thing we need to do is to somehow extract this information into a common place. For simplicity, let’s assume that we parsed and extracted that data into two tables i.e. order table (data source1) and tracking table ( data source 2).

ETL Data transformation
Now since the data can be from different sources and things are not in our control, we need to clean the data and validate that data!
So you perform various operations like Data cleansing, validation, manipulation, apply different business logic using some intermediate tables (sometimes called as staging tables) and finally come up with a single table joining the data.
ETL Data Loading
Since this data can be huge, you precompute this data with only required information and make this available to users by loading into data warehouse. Since this is like a shortlisted data, it becomes easier to build metric reports , ml models from this. This step is the load part of ETL.
In data world, they call this process as ETL (Extract, Transform, Load) . Where the 1st part is called data extraction, 2nd part is data transformation and third part is the data loading.
Wait, I still don’t see dbt in this!
dbt (data Build tool) Helps in Data transformation
To understand that, let’s zoom into what happens behind the scenes into Transform part. To make your raw data into something meaningful, you transform your data by applying various operations such as data cleaning, data validation and so on. Some quick examples can include removing duplicates, checking for null values, checking for primary keys, foreign keys and custom business rules like currency conversion and so on. In order to apply these rules, you
- Query the raw data with different SELECT queries
- Apply different data rules
- Select only required data
- Store them into separate tables for final data that you want to use daily. Since you need to generate this data every day , you build data pipelines , periodic jobs and finally store this computed data into your data warehouse for further use. From a development standpoint this requires a lot of effort to build these data pipelines. It includes developing, testing, documenting and deploying these changes.
What if you need to add a new metric to my data pipeline? How can you actually maintain this pipeline without breaking anything?
This is where Data Engineers come into picture. They help building these data pipelines to perform data analysis. But doesn’t this whole process look complicated? Transforming data into something useful itself looks like a very tedious process.
What if this whole process of data transformation can be simplified ? What if we have a toolkit that can do all these data transformation tasks with simple configurations and SELECT queries ?
Well, That’s exactly where dbt comes into picture.
With dbt you can streamline this whole data transformation process with simple configurations and SELECT queries. It can even help you develop, test, document, deploy these data transformation logics with a modular approach.
Again dbt is only a data transformation tool. It doesn’t handle data extraction or loading.
Let’s dig into how things change with dbt
Moving from ETL to ELT using dbt transformations
With dbt the workflow becomes more like an ELT instead of ETL. Now let’s see what ELT is.
In ETL , we saw that data is first extracted, transformed, loaded into warehouse.
But with ELT, this workflow changes a bit. The E part remains the same.
- We Extract the data from various sources
- Now this raw data is directly loaded into data warehouse without doing any transformation. (The key difference is in ETL data is processed and then loaded into warehouse. But in ELT data raw data is directly loaded into data warehouse without processing)
- Once we have raw data loaded, thats when dbt kicks in.
dbt connects with your data warehouse directly and can interact with all data reads and writes. If you want to perform some data analysis for example building a metric , all we need to do is write simple SELECT queries on the raw data table. Once you write your SELECT query and run it, dbt automatically takes care of fetching the data, applying all different validations, logics and writes the data back into your warehouse.
Real advantages of dbt
You might be thinking what is the real advantage here right. Well there is a lot. If you compare your old data flow with dbt based flow,
- You are interacting with raw data directly and only worry about writing SELECT queries.
- Complexity of developing , testing, documenting these SELECT queries are clearly modularized into dbt modules which we will study as part of this course.
- Deploying and adding new data is directly embedded into data analysis workflow. So if you want to build a new metric, you just have to change add a new SELECT query in dbt and the rest is taken care.
Now that you have some background, you can read more about dbt at getdbt
So using dbt, Data Engineers and Data Analysts can be combined into one single role called as Analytics Engineers.
Data Analytics + Data Engineers = Analytics Engineers
So your analytics engineers can act as software engineers as they can directly interact and modify data pipelines for faster data analysis.
If you don’t know what these roles are or you just started playing around Data, make sure to signup for dbt course towards dbt certification here.
First 20 people to signup for the course, will get course for free and next 30 people will get a 50% discount. Make sure to signup here.
- Tip: dbt is never spelled in capital letters.
Hope this post make things clear about dbt. In the next tutorial, we will talk about
- dbt Cloud and Step by step tutorial to setup your first dbt cloud project.
Make sure you subscribe to our website by subscribing to our mailing list and by following us on Twitter (@thetipseason)
Suggested Articles:
Google Carbon Programming language tutorial
dbt (data build tool) mysql with Vitess + planetscale
Top 10 most loved programming languages of 2022 and which companies use them
We hope you like this post. If you have any questions or suggestions or need any other additional info, please comment below.
We have started a coding community for most frequently used real world coding tips. You can join us here
TipSeason Discord channel
TipSeason Facebook Group
What do you want to learn next ? Drop a comment below!1600+ Midjourney prompts + 1500 AI Art prompt keywords, 25 categories, logo, tshirt, coloring page, characters , AI art prompts, Digital art https://t.co/X4zMgNepnk via @Etsy
— TipSeason⚡💡 (@thetipseason) April 11, 2023